I formulated this research question for my final project: “How has expanding use of the Internet impacted e-commerce in the United States?” The number of Internet users worldwide is constantly growing, and I wanted to see firsthand just how much Internet use and e-commerce have grown.
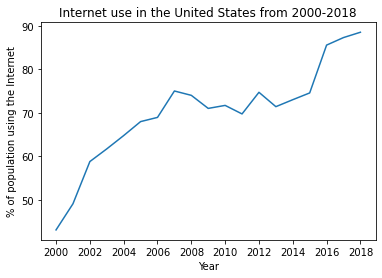
I started by looking at what percentage of the population has used the Internet from 2000 to 2018.
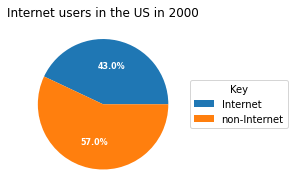
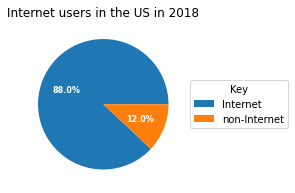
I also compared American Internet users in 2000 and 2018 using pie charts.
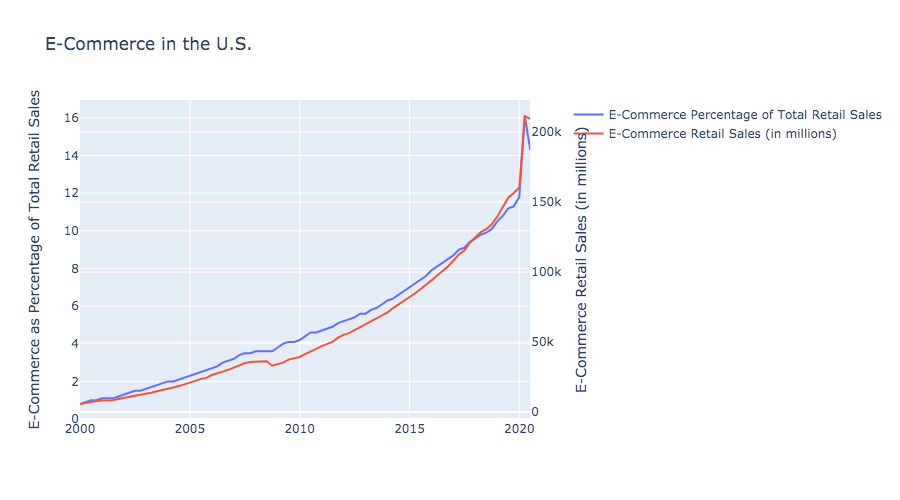
I created another line graph comparing e-commerce as a percentage of total retail sales to e-commerce retail sales in millions of dollars.
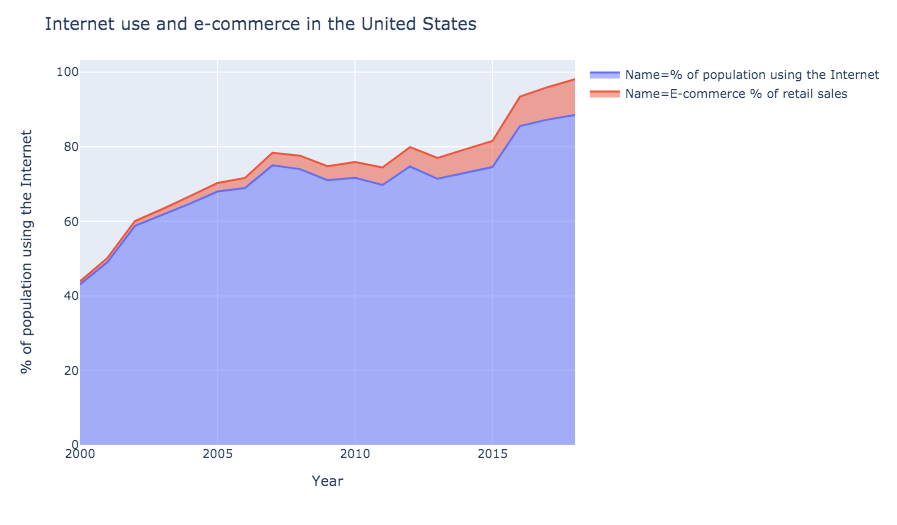
I created a stacked area graph comparing Internet use and e-commerce as a percentage of total retail sales.
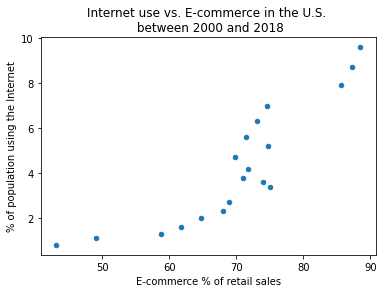
Finally, I created a scatter plot comparing Internet use in the U.S. and E-commerce as a percentage of total retail sales in the U.S.